灰度直方图是什么
图像的像素值大小用灰度来描述,通常而言灰度值范围为【0,255】,也称为灰度级。而灰度直方图(Gray histogram)是关于灰度级的分布函数,是图像灰度级分布的统计。简单地说,灰度直方图就是将图像中所有的像素点,按照灰度值的大小,统计其出现的频率。因此,灰度直方图是灰度级的函数,它表示了图像中具有某种灰度级(亮度)的像素个数,反映了图像中某种灰度级(亮度)出现的频率。
灰度直方图也称亮度直方图(Brightness histogram)。
灰度直方图有何作用
利用灰度直方图反应图像某种灰度级的出现频率这一特性,通过分析灰度直方图便可以知道图像的灰度级分布情况。从而可以选择一个或者多个合适的阈值,以供图像分割、边缘查找、阈值化操作等图像处理算子使用。所以灰度直方图一般用于以下的图像处理的阈值选择中。
- 阈值化操作(阈值分割、图像二值化等)
- 图像分割
- 边缘查找
如何计算灰度直方图
了解了灰度直方图的原理之后,计算灰度直方图就非常简单了。灰度直方图的本质为一个概率分布函数probability density function (PDF)。
计算步骤
代码
 1
 2
 3
 4
 5
 6
 7
 8
 9
10
11
12
13
14
15
16
17
18
19
|
#pragma once
// Copyright https://mangoroom.cn
// License(MIT)
// Author:mango
// gray histogram | 灰度直方图
// this is gray_histogram.h

#include<opencv2/opencv.hpp>
#include<array>

namespace imageprocess
{
	// gray histogram
	void GrayHistogram(const cv::Mat& gray_image, std::array<int, 256>& histogram);

	// histogram array to Mat
	void Histogram2Mat(const std::array<int, 256>& histogram, cv::Mat& histogram_mat);

}//namespace imageproccess
|
 1
 2
 3
 4
 5
 6
 7
 8
 9
10
11
12
13
14
15
16
17
18
19
20
21
22
23
24
25
26
27
28
29
30
31
32
33
34
35
36
37
38
39
40
41
42
43
44
45
46
47
48
49
50
51
52
53
54
55
56
57
58
|
// Copyright https://mangoroom.cn
// License(MIT)
// Author:mango
// gray histogram | 灰度直方图
// this is gray_histogram.cpp

#include"gray_histogram.h"

void imageprocess::GrayHistogram(const cv::Mat& gray_image, std::array<int, 256>& histogram)
{
	// check the input parameter : 检查输入参数
	assert(gray_image.channels() == 1);
	assert(histogram.size() == 256);

	// step1: All elements of the histogram array are assigned a value of 0 : 将数组histogram所有的元素赋值为0
	histogram = { 0 };

	// step2: Do hf[f(x,y)]+1 for all pixels of the image: 对图像所有元素,做hf[f(x,y)]+1
	for (size_t i = 0; i < gray_image.rows; i++)
	{
		for (size_t j = 0; j < gray_image.cols; j++)
		{
			int z = gray_image.at<uchar>(i, j);
			histogram.at(z) += 1;
		}
	}
}

void imageprocess::Histogram2Mat(const std::array<int, 256>& histogram, cv::Mat& histogram_mat)
{
	// Check the input parameter :检查输入参数
	assert(histogram.size() == 256);

	// step1: calculate the row of mat : 计算mat的row值
	int row = 0;
	for (size_t i = 0; i < histogram.size(); i++)
	{
		row = row > histogram.at(i) ? row : histogram.at(i);
	}

	// step2: initialize mat : 初始化mat
	histogram_mat = cv::Mat::zeros(row, 256, CV_8UC1);

	// step3: assign value for mat : 为mat赋值
	for (size_t i = 0; i < 256; i++)
	{
		int gray_level = histogram.at(i);

		if (gray_level > 0)
		{
			histogram_mat.col(i).rowRange(cv::Range(row - gray_level, row)) = 255;
		}
	}

	// step4: resize the histogram mat : 缩放直方图
	cv::resize(histogram_mat, histogram_mat, cv::Size(256, 256));
}
|
 1
 2
 3
 4
 5
 6
 7
 8
 9
10
11
12
13
14
15
16
17
18
19
20
21
22
23
24
|
// Copyright https://mangoroom.cn
// License(MIT)
// Author:mango
// image proccess algorithm  | 图像处理算法
// this is main.cpp

#include"gray_histogram.h"

int main()
{
	cv::Mat src_image = cv::imread("./images/lena.jpg", cv::IMREAD_GRAYSCALE);

	std::array<int, 256> histogram = { 0 };
	imageprocess::GrayHistogram(src_image, histogram);

	cv::Mat histogram_mat;
	imageprocess::Histogram2Mat(histogram, histogram_mat);

	cv::imshow("lena-histogram", histogram_mat);
	cv::imwrite("./images/lena-histogram.jpg", histogram_mat);
	cv::waitKey(0);

	return 0;
}
|
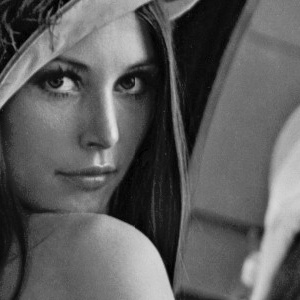
原图
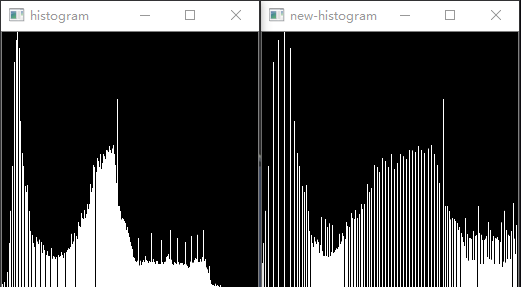
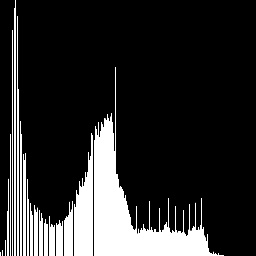
直方图
本文由芒果浩明发布,转载请注明来源。
本文链接:https://blog.mangoeffect.net/opencv/calculate-brightness-histogram-of-image.html